

ArcelorMittal S.A. MT
At closeNov 4, 2026, 6:32 AM EST
Pre-market · Nov 4, 6:32 AM ET
- YTD
- +32.59%
- 1 year
- +63.70%
- Market cap
- 45.43B
- Revenue (ttm)
- 62.85B
- Profit margin
- 2.88%
- EPS (ttm)
- 2.37
- Shares out
- 751.94M
- P/E ratio
- 25.49
- Forward P/E
- 8.51
- Dividend
- 0.60 (0.85%)
- Ex-dividend date
- Nov 12, 2026
- YTD return
- +32.59%
- 1-year return
- +63.70%
- Volume
- 1.03M
- Avg volume
- 1.34M
- Open
- 61.37
- Previous close
- 61.20
- Day's range
- 60.42 – 61.40
- 52-week range
- 36.70 – 79.68
- Beta
- 1.70
- Analysts
- Buy
- Price target
- 77.80 (+28.8%)
- Earnings date
- Nov 5, 2026
5D +0.27 (+0.45%)
Key statistics
- Enterprise value
- 103.87B
- PEG ratio
- 0.42
- Price / sales
- 0.72
- Price / book
- 1.66
- Dividend yield
- 0.98%
- Payout ratio
- 24.26%
- Revenue growth
- 5.20%
- Free cash flow
- -779.12M
- Total cash
- 4.85B
- Total debt
- 14.42B
- Return on equity
- 3.28%
- Short % of float
- 0.34%
- 50-day average
- 68.36
- 200-day average
- 63.77
Analyst view
Consensus: buy
- Target (low)
- 63.30
- Target (mean)
- 77.80
- Target (high)
- 93.00
- Strong buy2
- Buy3
- Hold3
- Sell0
- Strong sell0
Next earnings
Nov 5, 2026
Expected Nov 5, 2026. Consensus EPS estimate 0.93667.
Financials — quick view
Earnings
| Report date | Quarter ending | EPS estimate | EPS reported | Surprise | Surprise % |
|---|---|---|---|---|---|
| Nov 5, 2026 | Sep 30, 2026 | 0.80 | — | — | — |
| Jul 30, 2026 | Jun 30, 2026 | 1.18 | 0.89 | -0.29 | -24.58% |
| Apr 30, 2026 | Mar 31, 2026 | 0.72 | 0.75 | +0.03 | +4.17% |
| Feb 5, 2026 | Dec 31, 2025 | 0.56 | 0.86 | +0.30 | +53.57% |
| Nov 6, 2025 | Sep 30, 2025 | 0.58 | 0.62 | +0.04 | +6.90% |
| Jul 31, 2025 | Jun 30, 2025 | 1.33 | 1.32 | -0.01 | -0.75% |
Upgrades / downgrades
| Date | Firm | Action | From | To |
|---|---|---|---|---|
| Oct 9, 2026 | UBS | up | Neutral | Buy |
| Oct 6, 2026 | Wells Fargo | main | Equal-Weight | Equal-Weight |
| Aug 24, 2026 | Morgan Stanley | init | Overweight | Overweight |
| Jul 31, 2026 | Wells Fargo | main | Equal-Weight | Equal-Weight |
| Jul 10, 2026 | JP Morgan | up | Underweight | Neutral |
| Jul 9, 2026 | Wells Fargo | main | Equal-Weight | Equal-Weight |
About ArcelorMittal S.A.
ArcelorMittal S.A., together with its subsidiaries, operates as integrated steel and mining companies in the Americas, Europe, Asia, and Africa. It offers semi-finished flat products, including slabs; finished flat products comprising plates, hot- and cold-rolled coils and sheets, hot-dipped and electro-galvanized coils and sheets, tinplate, and color coated coils and sheets; semi-finished long products, such as blooms and billets; finished long products consisting of bars, wire-rods, structural sections, rails, sheet piles, and wire-products; and seamless and welded pipes and tubes. The company also provides mining products, such as iron ore lumps, fines, concentrate, pellets, and sinter feeds; and coking coal. It sells its products to various customers in the automotive, appliance, engineering, construction, energy, and machinery industries through a centralized marketing organization, and distributors. The company operates iron ore mining activities in Brazil, Bosnia, Liberia, Mexico, South Africa, and Ukraine, as well as in India and in Canada. ArcelorMittal S.A. was founded in 1976 and is headquartered in Luxembourg, Luxembourg.
- Sector
- Basic Materials
- Industry
- Steel
- Country
- Luxembourg
- Website
- corporate.arcelormittal.com
News
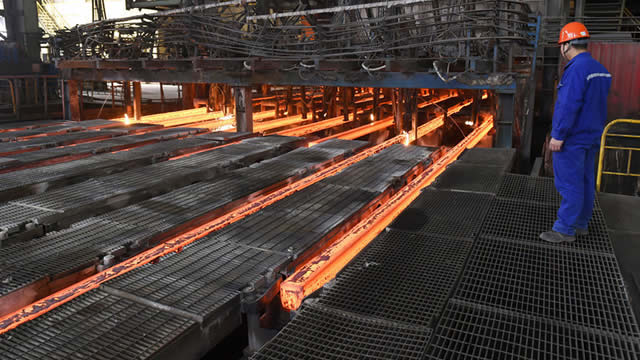 Wall Street's Insights Into Key Metrics Ahead of ArcelorMittal (MT) Q3 Earnings
 ArcelorMittal announces the publication of its third quarter 2026 sell-side analyst consensus figures
 Notification of share transactions by Lumen Investments S.à r.l
 Argenx, Caribou Biosciences And Other Big Stocks Moving Lower In Thursday’s Pre-Market Session
 Wells Fargo Maintains Equal-Weight on ArcelorMittal, Lowers Price Target to $64
Your note
Sign in to keep a note on MT — it syncs with the Stock Master app.
Institution ownership
| Holder | % held | Shares | Value | Reported |
|---|---|---|---|---|
| FMR, LLC | 1.47% | 11,391,416 | 688.27M | Jun 29, 2026 |
| Dimensional Fund Advisors LP | 0.42% | 3,253,361 | 196.57M | Jun 29, 2026 |
| Maple Rock Capital Partners, Inc. | 0.28% | 2,190,860 | 132.37M | Jun 29, 2026 |
| Blackrock Inc. | 0.19% | 1,471,254 | 88.89M | Jun 29, 2026 |
| Morgan Stanley | 0.19% | 1,503,680 | 90.85M | Jun 29, 2026 |
| Goldman Sachs Group Inc | 0.17% | 1,299,500 | 78.52M | Jun 29, 2026 |
Fund ownership
| Holder | % held | Shares | Value | Reported |
|---|---|---|---|---|
| iShares Trust-iShares Core MSCI EAFE ETF | 0.42% | 3,228,417 | 195.06M | Sep 29, 2026 |
| Fidelity Puritan Trust-Fidelity Puritan Fund | 0.38% | 2,975,300 | 179.77M | Aug 30, 2026 |
| Fidelity Securities Fund-Fidelity OTC Portfolio | 0.21% | 1,612,300 | 97.42M | Aug 30, 2026 |
| iShares Trust-iShares MSCI EAFE ETF | 0.20% | 1,519,025 | 91.78M | Sep 29, 2026 |
| Fidelity Advisor Series I-Fidelity Advisor Equity Growth Fund | 0.16% | 1,230,120 | 74.32M | Aug 30, 2026 |
| iShares Trust-iShares MSCI EAFE Value ETF | 0.16% | 1,203,509 | 72.72M | Sep 29, 2026 |