

Ingenia Communities Group INGEF
3.25 USD 0.00 (+0.00%)
At closeNov 3, 2026, 4:00 PM EST
2.80 Day range 2.80
2.45 52-week range 4.25
- YTD
- -13.10%
- 1 year
- -23.53%
- Market cap
- 1.32B
- EPS (ttm)
- 0.31
- P/E ratio
- 10.48
- YTD return
- -13.10%
- 1-year return
- -23.53%
- Volume
- 449
- Avg volume
- 607
- Open
- 2.80
- Previous close
- 3.25
- Day's range
- 2.80 – 2.80
- 52-week range
- 2.45 – 4.25
- Earnings date
- Aug 25, 2026
2Y -0.23 (-6.61%)
Next earnings
Aug 25, 2026
Expected Aug 25, 2026. Consensus EPS estimate 0.1293.
Earnings
| Report date | Quarter ending | EPS estimate | EPS reported | Surprise | Surprise % |
|---|---|---|---|---|---|
| Aug 25, 2026 | Jun 30, 2026 | 0.1293 | — | — | — |
| Feb 24, 2026 | Dec 31, 2025 | 0.1053 | 0.1014 | 0.00 | -3.70% |
| Aug 25, 2025 | Jun 30, 2025 | 0.09077 | 0.09206 | 0.00 | +1.42% |
| Feb 24, 2025 | Dec 31, 2024 | 0.07869 | 0.1312 | +0.05 | +66.73% |
| Aug 19, 2024 | Jun 30, 2024 | 0.07832 | 0.08666 | +0.01 | +10.65% |
| Feb 20, 2024 | Dec 31, 2023 | 0.1024 | 0.07284 | -0.03 | -28.87% |
News
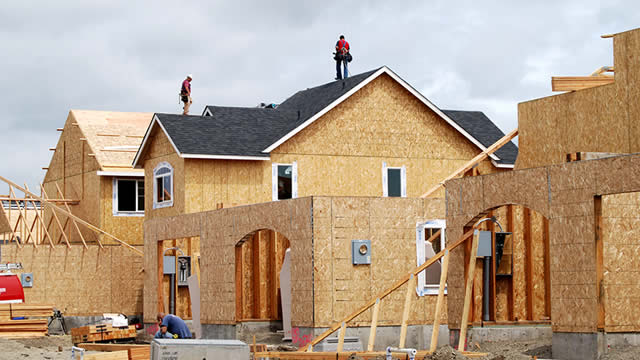 Third Avenue International Real Estate Value Fund Q3 2026 Portfolio Activity
 Third Avenue Real Estate Value Fund Q3 2026 Portfolio Activity
 Ingenia shares climb as Warburg Pincus lifts takeover bid to $2.14 billion
 Ingenia Communities Group Stapled Units (INGEF) Q4 2026 Earnings Call Transcript
 Ingenia Communities Group (OTCMKTS:INGEF) and BRT Apartments (NYSE:BRT) Head to Head Comparison
 Ingenia Communities Group Stapled Units (INGEF) Q2 2026 Earnings Call Transcript
Your note
Sign in to keep a note on INGEF — it syncs with the Stock Master app.