

Glencore plc GLNCY
13.59 USD +0.15 (+1.12%)
Nov 4, 2026, 3:58 PM EST
13.45 Day range 13.70
8.66 52-week range 17.05
- YTD
- +24.34%
- 1 year
- +50.33%
- Market cap
- 79.60B
- EPS (ttm)
- 0.90
- P/E ratio
- 15.10
- YTD return
- +24.34%
- 1-year return
- +50.33%
- Volume
- 57.66K
- Avg volume
- 740.62K
- Open
- 13.61
- Previous close
- 13.44
- Day's range
- 13.45 – 13.70
- 52-week range
- 8.66 – 17.05
- Earnings date
- Feb 24, 2027
2Y +3.02 (+28.57%)
Next earnings
Feb 24, 2027
Expected Feb 24, 2027. Consensus EPS estimate 0.302.
Earnings
| Report date | Quarter ending | EPS estimate | EPS reported | Surprise | Surprise % |
|---|---|---|---|---|---|
| Feb 24, 2027 | Dec 31, 2026 | 0.302 | — | — | — |
| Aug 5, 2026 | Jun 30, 2026 | 0.2838 | 0.37 | +0.09 | +30.37% |
| Feb 18, 2026 | Dec 31, 2025 | 0.161 | 0.15 | -0.01 | -6.83% |
| Aug 6, 2025 | Jun 30, 2025 | 0.02667 | -0.10809 | -0.13 | -505.29% |
| Feb 19, 2025 | Dec 31, 2024 | 0.1868 | -0.11409 | -0.30 | -161.08% |
| Oct 30, 2024 | Jun 30, 2024 | 0.1352 | -0.01917 | -0.15 | -114.18% |
News
 Glencore earns UBS Buy rating as copper growth strengthens outlook
 Is Glencore (GLNCY) Stock Undervalued Right Now?
 Glencore upgraded as JP Morgan forecasts over 30% copper growth
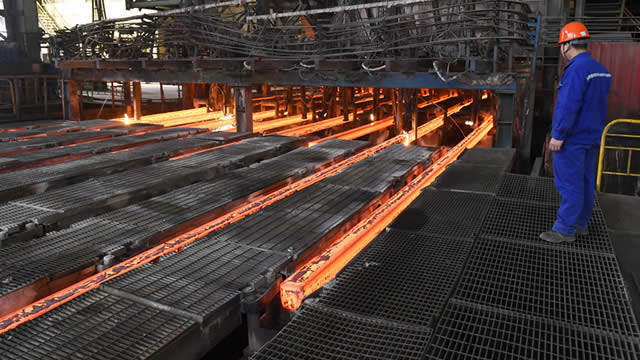 Glencore shares to start trading in Australia as miner hopes to boost valuation
 Glencore's copper growth supports Deutsche Bank's 680p target
 Glencore sees electrification trend driving strong uptake for Australia listing
 GLNCY vs. NGLOY: Which Stock Is the Better Value Option?
 Glencore raises marketing profit guidance as Citi flags consensus upgrades
 Glencore raises 2026 marketing profit outlook, resets long-term guidance framework
 Glencore, Peabody and Heeney Capital weigh Venezuela coal deals, Bloomberg News reports
Your note
Sign in to keep a note on GLNCY — it syncs with the Stock Master app.