

Freeport-McMoRan Inc. FCX
At closeNov 4, 2026, 6:16 PM EST
After hours · Nov 4, 6:16 PM ET
- YTD
- +23.25%
- 1 year
- +58.80%
- Market cap
- 89.89B
- Revenue (ttm)
- 26.44B
- Profit margin
- 13.03%
- EPS (ttm)
- 2.38
- Shares out
- 1.44B
- P/E ratio
- 26.30
- Forward P/E
- 14.63
- Dividend
- 0.60 (0.97%)
- Ex-dividend date
- Oct 14, 2026
- YTD return
- +23.25%
- 1-year return
- +58.80%
- Volume
- 11.31M
- Avg volume
- 12.25M
- Open
- 63.50
- Previous close
- 61.77
- Day's range
- 61.06 – 64.09
- 52-week range
- 38.54 – 80.24
- Beta
- 1.37
- Analysts
- Buy
- Price target
- 78.75 (+25.8%)
- Earnings date
- Jan 28, 2027
5D -1.84 (-2.86%)
Key statistics
- Enterprise value
- 105.13B
- PEG ratio
- 3.57
- Price / sales
- 3.40
- Price / book
- 4.18
- Dividend yield
- 0.97%
- Payout ratio
- 29.56%
- Revenue growth
- 8.20%
- Free cash flow
- 1.87B
- Total cash
- 4.34B
- Total debt
- 10.36B
- Return on equity
- 15.72%
- Short % of float
- 1.83%
- 50-day average
- 70.99
- 200-day average
- 65.24
Analyst view
Consensus: buy
- Target (low)
- 33.00
- Target (mean)
- 78.75
- Target (high)
- 90.00
- Strong buy6
- Buy12
- Hold4
- Sell1
- Strong sell0
Next earnings
Jan 28, 2027
Expected Jan 28, 2027. Consensus EPS estimate 1.07.
Financials — quick view
Earnings
| Report date | Quarter ending | EPS estimate | EPS reported | Surprise | Surprise % |
|---|---|---|---|---|---|
| Jan 28, 2027 | Dec 30, 2026 | 1.09 | — | — | — |
| Oct 27, 2026 | Sep 30, 2026 | 0.815 | 0.88 | +0.07 | +7.98% |
| Jul 22, 2026 | Jun 30, 2026 | 0.60 | 0.68 | +0.08 | +13.33% |
| Apr 23, 2026 | Mar 31, 2026 | 0.4665 | 0.57 | +0.10 | +22.19% |
| Jan 22, 2026 | Dec 31, 2025 | 0.2852 | 0.47 | +0.18 | +64.80% |
| Oct 23, 2025 | Sep 30, 2025 | 0.4212 | 0.50 | +0.08 | +18.71% |
Upgrades / downgrades
| Date | Firm | Action | From | To |
|---|---|---|---|---|
| Nov 2, 2026 | Freedom Broker | main | Hold | Hold |
| Oct 28, 2026 | UBS | main | Buy | Buy |
| Oct 28, 2026 | JP Morgan | main | Overweight | Overweight |
| Oct 28, 2026 | Scotiabank | main | Sector Outperform | Sector Outperform |
| Oct 28, 2026 | Wells Fargo | main | Overweight | Overweight |
| Oct 19, 2026 | Barclays | main | Overweight | Overweight |
About Freeport-McMoRan Inc.
Freeport-McMoRan Inc. engages in the mining of mineral properties in North America, South America, and Indonesia. The company primarily explores for copper, gold, molybdenum, silver, and other metals. Its assets include the Grasberg minerals district in Indonesia; Morenci, Bagdad, Safford, Sierrita, and Miami in Arizona; Chino and Tyrone in New Mexico; and Henderson and Climax in Colorado, North America, as well as Cerro Verde in Peru and El Abra in Chile. The company was formerly known as Freeport-McMoRan Copper & Gold Inc. and changed its name to Freeport-McMoRan Inc. in July 2014. The company was incorporated in 1987 and is headquartered in Phoenix, Arizona.
- Sector
- Basic Materials
- Industry
- Copper
- Country
- United States
- Website
- fcx.com
News
 Democratic Sweep Revives the Stalled Copper Tariff Trade
 Freeport-McMoRan: 3 Key Takeaways for Long-Term Investors
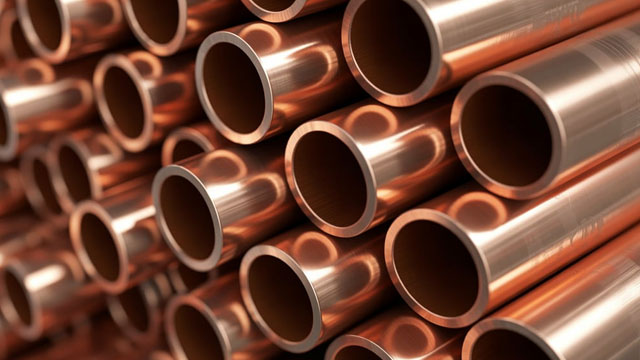 Down 14.9% in 4 Weeks, Here's Why You Should You Buy the Dip in Freeport-McMoRan (FCX)
 Freeport Approves $4.5B Expansion And Modernization Program For Wholly Owned Badgad Copper And Molybdenum Operations
 Freeport Announces Plans to Boost U.S. Copper & Molybdenum Production
 Here's How Much $100 Invested In Freeport-McMoRan 10 Years Ago Would Be Worth Today
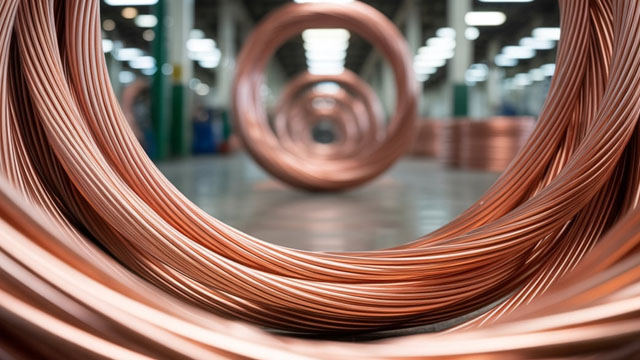 Freeport-McMoRan: Grasberg Remains On Schedule, And I Remain At Buy
 BOCHK Asset Management Ltd Acquires 46,500 Shares of Freeport-McMoRan Inc. $FCX
 Freeport-McMoRan Inc. $FCX Holdings Decreased by Bank Julius Baer & Co. Ltd Zurich
 Freedom Broker Maintains Hold on Freeport-McMoRan, Lowers Price Target to $68
Your note
Sign in to keep a note on FCX — it syncs with the Stock Master app.
Insider holders
| Insider | Relation | Latest transaction | Date | Shares held |
|---|---|---|---|---|
| ADKERSON RICHARD C | Chairman of the Board | Stock Gift | Mar 5, 2026 | 0 |
| CURRAULT DOUGLAS NICHOLAS II | General Counsel | Sale | Aug 24, 2026 | 211,016 |
| HIGGINS STEPHEN T | Officer | Sale | Aug 4, 2026 | 0 |
| KENNARD LYDIA H | Director | Sale | Aug 26, 2026 | 122,702 |
| LANCE RYAN MICHAEL | Director | Stock Award(Grant) | May 31, 2026 | 55,622 |
| MCCOY DUSTAN E | Director | Stock Award(Grant) | May 31, 2026 | 155,100 |
Institution ownership
| Holder | % held | Shares | Value | Reported |
|---|---|---|---|---|
| Blackrock Inc. | 8.49% | 121,954,704 | 7.64B | Jun 29, 2026 |
| Vanguard Capital Management LLC | 6.54% | 93,905,396 | 5.88B | Jun 29, 2026 |
| Fisher Asset Management, LLC | 4.66% | 66,922,014 | 4.19B | Jun 29, 2026 |
| State Street Corporation | 4.63% | 66,485,424 | 4.16B | Jun 29, 2026 |
| Capital Research Global Investors | 2.89% | 41,503,051 | 2.60B | Jun 29, 2026 |
| Franklin Resources, Inc. | 2.60% | 37,381,125 | 2.34B | Jun 29, 2026 |
Fund ownership
| Holder | % held | Shares | Value | Reported |
|---|---|---|---|---|
| VANGUARD INDEX FUNDS-Vanguard Total Stock Market Index Fund | 3.18% | 45,638,707 | 2.86B | Jun 29, 2026 |
| VANGUARD INDEX FUNDS-Vanguard 500 Index Fund | 2.59% | 37,252,727 | 2.33B | Jun 29, 2026 |
| Capital World Growth & Income Fund | 1.85% | 26,597,577 | 1.67B | Sep 29, 2026 |
| iShares Trust-iShares Core S&P 500 ETF | 1.33% | 19,135,108 | 1.20B | Sep 29, 2026 |
| Fidelity Concord Street Trust-Fidelity 500 Index Fund | 1.30% | 18,662,435 | 1.17B | Sep 29, 2026 |
| SPDR S&P 500 ETF TRUST-State Street SPDR S&P 500 ETF Trust | 1.24% | 17,744,978 | 1.11B | Sep 29, 2026 |