

DTE Energy Company 2020 Series DTB
14.97 USD +0.03 (+0.20%)
At closeNov 3, 2026, 4:17 PM EST
14.95 -0.02 -0.13%
After hours · Nov 3, 4:17 PM ET
14.92 Day range 15.00
14.41 52-week range 18.32
- YTD
- -12.20%
- 1 year
- -17.20%
- Market cap
- 3.10B
- YTD return
- -12.20%
- 1-year return
- -17.20%
- Volume
- 68.28K
- Avg volume
- 39.21K
- Open
- 14.94
- Previous close
- 14.94
- Day's range
- 14.92 – 15.00
- 52-week range
- 14.41 – 18.32
- Earnings date
- Oct 22, 2026
2Y -5.17 (-25.72%)
Key statistics
- Price / sales
- 0.00
- Dividend yield
- 0.00%
- Payout ratio
- 0.00%
- 50-day average
- 15.19
- 200-day average
- 16.51
Next earnings
Oct 22, 2026
Expected Oct 22, 2026. Consensus EPS estimate 0.00.
Earnings
| Report date | Quarter ending | EPS estimate | EPS reported | Surprise | Surprise % |
|---|---|---|---|---|---|
| Oct 22, 2026 | Sep 30, 2026 | 2.45 | — | — | — |
| Jul 28, 2026 | Jun 30, 2026 | 1.14 | 1.32 | +0.18 | +15.79% |
| Apr 30, 2026 | Mar 31, 2026 | 2.01 | 1.95 | -0.06 | -2.99% |
| Feb 17, 2026 | Dec 31, 2025 | 1.52 | 1.65 | +0.13 | +8.55% |
| Oct 30, 2025 | Sep 30, 2025 | 2.11 | 2.25 | +0.14 | +6.64% |
| Jul 29, 2025 | Jun 30, 2025 | 1.40 | 1.36 | -0.04 | -2.86% |
News
 DTB Ratifies UN Principles on Sustainable Banking
 Why the Supreme Court ordered a retrial of Ham’s shs120bn case against DTB
 “Attorney General Kiwanuka and Karugire are after my life” – Tycoon Ham cries out
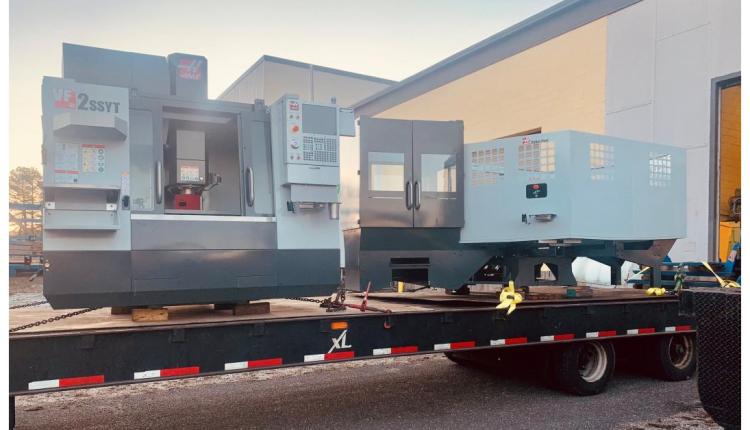 Dayton T. Brown, Inc. Makes Additional Investments in Precision Machining Center
 Diamond Trust Bank to issue payments cards to fintechs in Kenya
 DTB to open 17 new branches in expansion drive
Your note
Sign in to keep a note on DTB — it syncs with the Stock Master app.