

Vistry Group PLC BVHMF
3.48 USD +0.03 (+0.87%)
At closeNov 9, 2026, 4:00 PM EST
3.48 Day range 3.48
2.88 52-week range 10.39
- YTD
- -59.06%
- 1 year
- -57.56%
- Market cap
- 1.11B
- EPS (ttm)
- -2.12
- YTD return
- -59.06%
- 1-year return
- -57.56%
- Volume
- 350
- Avg volume
- 15.71K
- Open
- 3.48
- Previous close
- 3.45
- Day's range
- 3.48 – 3.48
- 52-week range
- 2.88 – 10.39
- Earnings date
- Sep 24, 2026
No chart data for this range yet.
Next earnings
Sep 24, 2026
Expected Sep 24, 2026. Consensus EPS estimate -0.08564.
Earnings
| Report date | Quarter ending | EPS estimate | EPS reported | Surprise | Surprise % |
|---|---|---|---|---|---|
| Sep 24, 2026 | Jun 30, 2026 | -0.08564 | — | — | — |
| Mar 4, 2026 | Dec 31, 2025 | 0.541 | 0.559 | +0.02 | +3.33% |
| Sep 10, 2025 | Jun 30, 2025 | — | 0.1288 | — | — |
| Mar 26, 2025 | Dec 31, 2024 | — | -0.14824 | — | — |
| Sep 5, 2024 | Jun 30, 2024 | — | 0.4198 | — | — |
| Mar 14, 2024 | Dec 31, 2023 | 0.712 | 0.501 | -0.21 | -29.63% |
News
 UK's Vistry starts cutting jobs as part of restructuring
 UK's Vistry appoints Severn Trent finance head Helen Miles as CFO
 Vistry Group PLC (BVHMY) Q2 2026 Earnings Call Transcript
 Vistry Group shares fall 6% as profit and cash outlook worsen
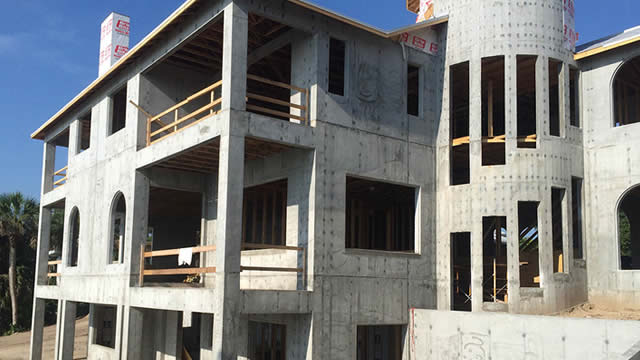 Vistry swings to £661 million loss as housebuilder unveils major restructuring
 RBC keeps 'underperform' rating on Vistry ahead of strategic review
 Vistry shares jump over 14% after £350 million affordable homes grant award
 Vistry shares slide 9% amid reports credit insurer cuts supplier cover
 Vistry Plc: High Reward And High-Risk Turnaround Play
 Vistry Group Q2 Earnings Call Highlights
Your note
Sign in to keep a note on BVHMF — it syncs with the Stock Master app.