

BioXcel Therapeutics, Inc. BTAI
At closeSep 4, 2026, 4:00 PM EDT
After hours · Sep 4, 4:00 PM ET
- YTD
- -95.38%
- 1 year
- -96.36%
Discussion (85)
Sign in to join the discussion
$BTAI seems to have bottomed out, next resistance is 3.17 which it will surely reach.

$BTAI seems to have consolidated in this area, we will see if it looks for MA200d


$BTAI Inverted Hammer Pattern ?
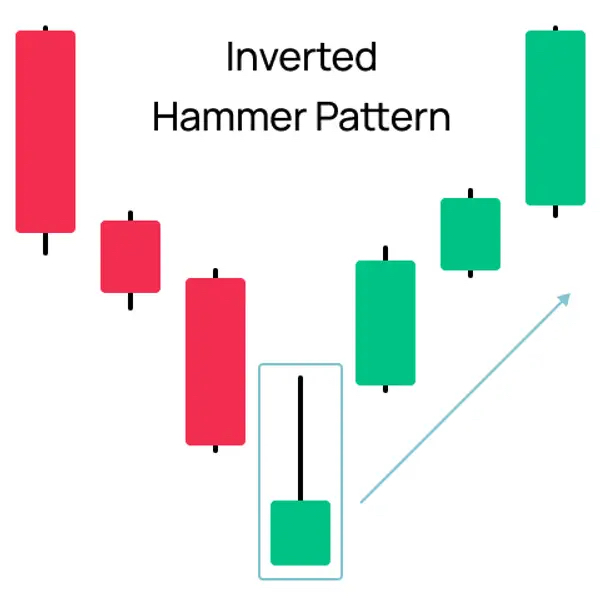
$BTAI The Candlestick Patterns Hammer and Inverted Hammer both are bullish reversal patterns that indicate the end of a downtrend and the beginning of an uptrend. Hammer and Inverted Hammer candlestick patterns show that buyers are gaining strength, which could lead to an upward momentum. Below is a detailed explanation of each

$BTAI Uggly
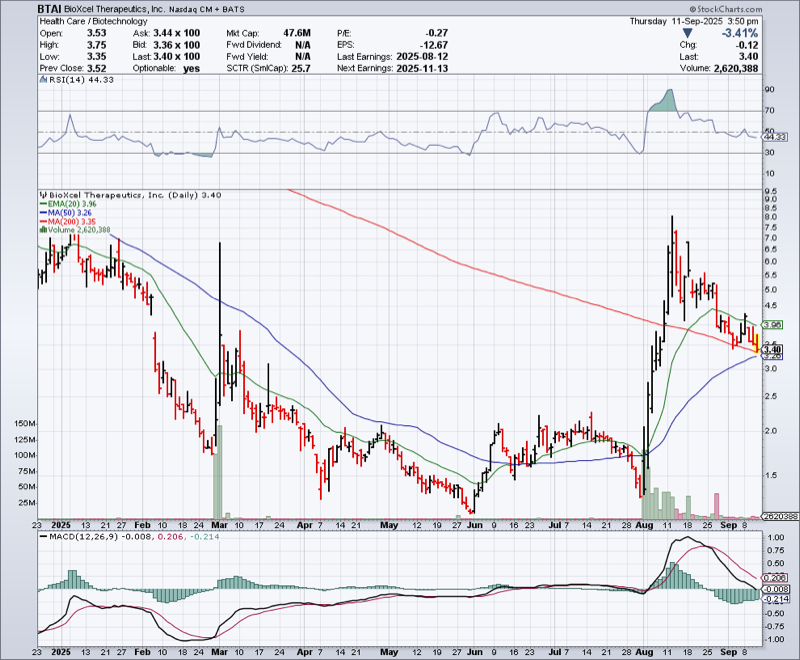
$BTAI Mizuho has raised its price target on BioXcel Therapeutics (NASDAQ:BTAI) to $4.00 from $2.00 while maintaining a Neutral rating following positive Phase 3 SERENITY At-Home study data for Igalmi/BXCL501. The stock, currently trading at $3.48, has shown significant volatility with a 42.5% gain over the past six months despite a challenging year-to-date performance.
$BTAI ?

