

Tribeca Strategic Acquisition Corp. BID
9.93 USD +0.03 (+0.25%)
At closeNov 4, 2026, 4:00 PM EST
9.95 +0.02 +0.22%
After hours · Nov 4, 4:00 PM ET
9.93 Day range 9.95
9.83 52-week range 10.01
- YTD
- +0.86%
- 1 year
- +0.86%
- Market cap
- 191.32M
- YTD return
- +0.86%
- 1-year return
- +0.86%
- Volume
- 4.44K
- Avg volume
- 28.27K
- Open
- 9.94
- Previous close
- 9.90
- Day's range
- 9.93 – 9.95
- 52-week range
- 9.83 – 10.01
2Y +0.09 (+0.91%)
Financials — quick view
BID Revenue — quarterly 0
BID Net income — quarterly 243.47K
BID EPS — quarterly 0.03
News
 Veradermics Reports Second Quarter 2026 Financial Results and Highlights Recent Corporate and Clinical Progress
 Tribeca Strategic Acquisition Corp. Announces the Separate Trading of its Class A Ordinary Shares and Share Rights, Commencing on July 20, 2026
 Tribeca Strategic Acquisition Corp. Announces Closing of $140,000,000 Initial Public Offering
 Tribeca Strategic Acquisition Corp. Announces Pricing of $140,000,000 Initial Public Offering
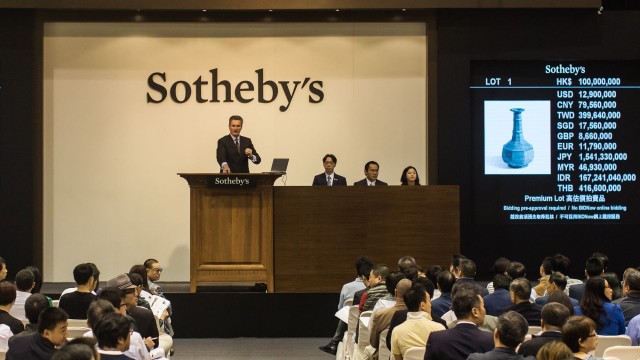 Sotheby's ramps up NFT operations
 Zhihu IPO: China's Quora With Surging Sales Growth
 Top 10 Most Oversold Stocks Via Benzinga Pro's Screener Tool For Mon., September 30, 2019
 Top 10 Most Oversold Stocks Via Benzinga Pro's Screener Tool For Fri., September 27, 2019
- Earnings Scheduled For July 30, 2019
 Report: Sotheby's Could Get Other Offers
Your note
Sign in to keep a note on BID — it syncs with the Stock Master app.