

BASF SE BASFY
15.26 USD +0.08 (+0.53%)
At closeNov 10, 2026, 4:00 PM EST
15.20 Day range 15.28
12.04 52-week range 16.25
- YTD
- +17.75%
- 1 year
- +22.47%
- Market cap
- 52.55B
- EPS (ttm)
- 0.65
- P/E ratio
- 23.48
- YTD return
- +17.75%
- 1-year return
- +22.47%
- Volume
- 9.23K
- Avg volume
- 144.37K
- Open
- 15.27
- Previous close
- 15.18
- Day's range
- 15.20 – 15.28
- 52-week range
- 12.04 – 16.25
- Earnings date
- Oct 28, 2026
5D -0.04 (-0.26%)
Next earnings
Oct 28, 2026
Expected Oct 28, 2026. Consensus EPS estimate 0.12.
Earnings
| Report date | Quarter ending | EPS estimate | EPS reported | Surprise | Surprise % |
|---|---|---|---|---|---|
| Oct 28, 2026 | Sep 30, 2026 | 0.12 | — | — | — |
| Jul 29, 2026 | Jun 30, 2026 | 0.2354 | 0.37 | +0.13 | +57.18% |
| Apr 30, 2026 | Mar 31, 2026 | 0.3131 | 0.3871 | +0.07 | +23.63% |
| Feb 27, 2026 | Dec 31, 2025 | 0.05358 | -0.12 | -0.17 | -323.96% |
| Oct 29, 2025 | Sep 30, 2025 | 0.11 | 0.05 | -0.06 | -54.55% |
| Jul 30, 2025 | Jun 30, 2025 | 0.20 | 0.14 | -0.06 | -30.00% |
News
 BASF, Evonik management held talks over weekend, sources say
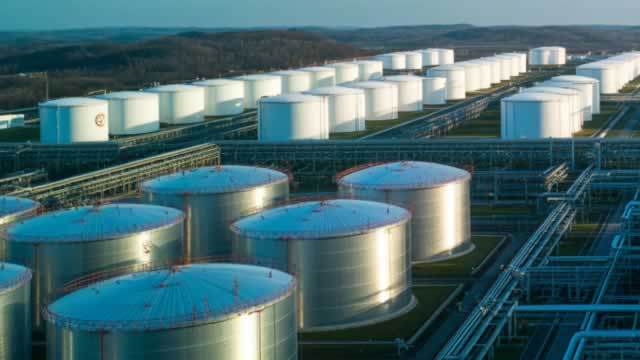 BASF's $12.5 Billion Takeover Bid for Evonik Rebuffed
 Evonik likely to reject BASF's sweetened $12.5 billion bid, FT reports
 BASFY Launches Lincare to Improve Post-Laser Skincare
 BASF SE (BASFY) Q3 2026 Press Conference Call Transcript
 BASFY Expands APG Manufacturing Facility in Cincinnati
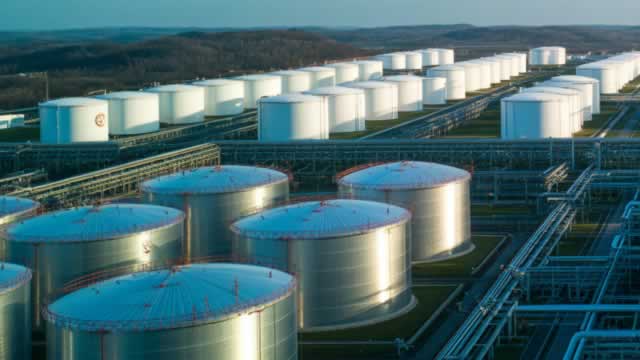 What Basf (BAS) Said on Its Q3 Earnings Call
 BASF SE (BASFY) Q3 2026 Earnings Call Transcript
 Basf Q3 Earnings Call Highlights
 BASF Lifts Full-Year Earnings Outlook After Strong Third Quarter
Your note
Sign in to keep a note on BASFY — it syncs with the Stock Master app.