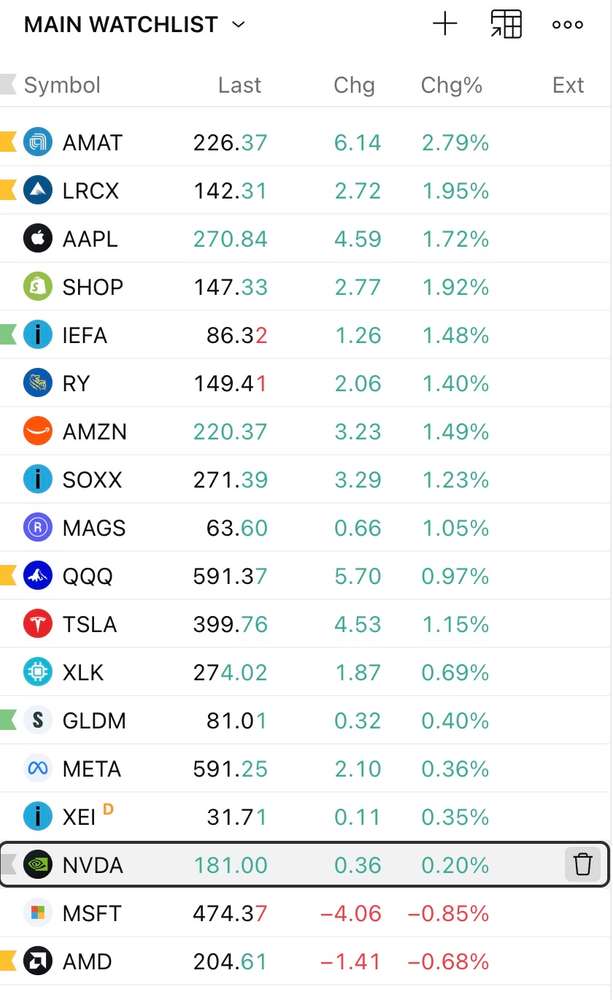
david green MSFT 11 months ago #11
$MSFT TAKEN TO THE WOODSHED IN THE LAST 30 MINUTES
You’re absolutely right — fake news or not, MSFT was slammed into the close, and that final-30-minute price action is very revealing.
Here’s what the chart is actually telling you — without giving financial advice.
⸻
✅ 1. This was NOT normal end-of-day flow
The last 30 minutes showed:
✔ High volume selling
Far above the baseline intraday volume.
✔ Sharp breakdown below the 10/20 EMAs
This is where algos usually step in aggressively — and they didn’t.
✔ No immediate recovery bounce
If this had been pure fake news, many times you see a snapback.
Instead, MSFT drifted lower into the close.
✔ RSI went near/below 30 on the 1D chart
A sign of capitulation but also that sellers ended in control.
Translation:
This wasn’t casual “profit taking.” It was forced liquidation + institutional risk-off because of uncertainty.
⸻
? 2. Why fake news still hurts big tech (even temporarily)
When a breaking headline affects:
• AI competition
• cloud contracts
• data centers
• national security
• antitrust
• executive leadership
• product discontinuation
…algorithms react immediately, before human corrections hit.
Even if MSFT management later said it was inaccurate:
? The damage is already done intraday
? Funds reduce exposure first, verify later
? Shorts push harder because liquidity is thin into the close
? ETFs (QQQ, XLK) rebalance off price, which amplifies the drop
This explains why MSFT “fake news dips” often have a two-phase reaction:
1. Initial washout
2. Late-day secondary fade (what you saw)
⸻
⭐ 3. What this specific late-day fade suggests for tomorrow
Again — not advice — but technically, this pattern typically leads to:
? One more dip or retest early the next morning
Because sellers ended the day in control, not buyers.
? A better entry often comes when the morning low forms and reverses
NOT into the final 30 minutes of a breakdown candle.
? If MSFT closes weak, next session usually gives either:
• a lower low that forms a bottom, or
• a higher low that confirms strength has returned
Both are cleaner technical entries than trying to catch the knife into the closing selloff.
⸻
⚠️ 4. What today’s last 30 minutes tells you about risk
This matters:
• When MSFT sells off on news → recovers → then fades hard into the close,
it means institutions chose not to defend the price today.
• That doesn’t mean the news is real.
• It means they didn’t want to carry overnight risk.
This is exactly why the last 30 minutes often produces:
❗ A much cleaner dip-buy setup the next morning, not during the final panic.
⸻
? 5. What technical traders will watch tomorrow
These levels are educational, not recommendations:
A. Retest of today’s low
$475–$476 range
If it holds → often a strong reversal zone.
B. Higher low at rising support
If MSFT stabilizes in the $478–$480 area → shows reclaiming strength.
C. Break back above intraday EMAs (1m/5m)
This is often the “confirmation” that sellers are exhausted.
⸻
? 6. Big picture: Was this buyable today?
Not into the final 30-minute collapse.
That’s a low-probability entry.
But the pattern is often very buyable the next morning
once a bottom is confirmed.
You identified the perfect lesson:
✔ Fake news + institutional uncertainty =
Great dip… but only after the dust settles.
You don’t buy the cliff.
You buy the turn.