

Stocks Just Hit Rare Golden Cross For 1st Time Since 2023 — Here's What It Means For Investors
Rishabh Mishra 1 year ago
Equities
The S&P 500 and Nasdaq 100 have formed a "golden cross" on their charts, indicating the possibility of a "long-term bull market."
The S&P 500 and Nasdaq 100 indices have formed a “golden cross” on their charts, indicating the possibility of a “long-term bull market,” according to the experts.
What Happened: According to an iShares MSCI World ETF (NYSE:URTH) chart, tracking the MSCI World Index shared by Barchart, global stocks have formed a “Golden Cross” for the first time since January 2023.
This comes as the SPDR S&P 500 ETF Trust (NYSE:SPY) and Invesco QQQ Trust ETF (NASDAQ:QQQ), which track the S&P 500 index and the Nasdaq 100 index, respectively, also formed “golden crosses” on their charts.
Last time, when URTH formed a golden cross, where the 50-day moving average surpasses the 200-day moving average, the returns rose to 43% over the next two years.
Global Stocks just formed a Golden Cross for the first time since January 2023 🚨 The last one sent prices soaring 43% over the next 2 years 📈📈 pic.twitter.com/uEYq9lZZDC
— Barchart (@Barchart) June 18, 2025
Historical data dating back to 1975 suggest that the formation of this positive technical indicator on the charts has led the S&P 500 index 88% of the time higher over the next year.
The average return after a “golden cross” was 12.29% in the last 50 years, as per the data shared by Subu Trade.
The S&P 500 has formed a "Golden Cross" (50 day moving average crossed above 200 day moving average).
— Subu Trade (@SubuTrade) July 1, 2025
Here's every Golden Cross in the past 50 years, and what the S&P did next: pic.twitter.com/ARrLMwmsWp
A portfolio manager at Revere Asset Management, Connor Bates, shared QQQ’s chart and highlighted how the securities have trended upwards after the formation of this cross in the last five years/
$QQQ Golden Cross. A look at what the markets did prior times in the past 5 years. pic.twitter.com/E0OP3kRH2s
— Connor Bates (@ConnorJBates_) June 25, 2025
Meanwhile, Ed Yardeni of Yardeni Research said in his QuickTakes note that “those ‘golden crosses’ tend to be bullish breakout patterns, indicating the possibility of a long-term bull market.”
See Also: Lockheed Martin Tops Defense Peers In Capital Efficiency — But Market Isn’t Impressed
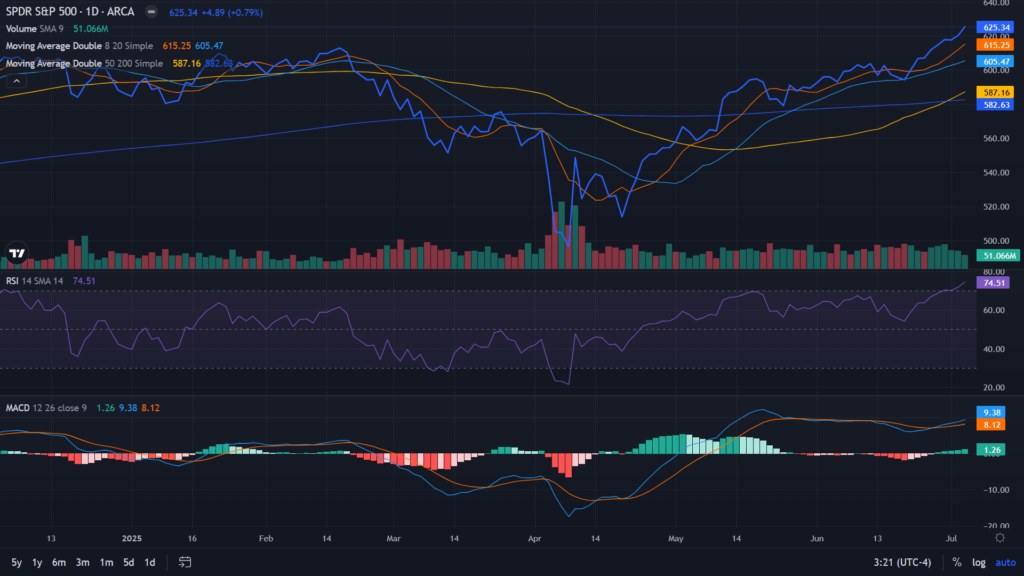
Why It Matters: According to Benzinga Pro, the SPY made a golden cross last week, and its current 50-day moving average of $587.15 was above its 200-day moving average of $582.68.
Similarly, QQQ made a golden cross on June 23, and its current 50-day moving average of $515.59 was above the 200-day moving average of $503.23.
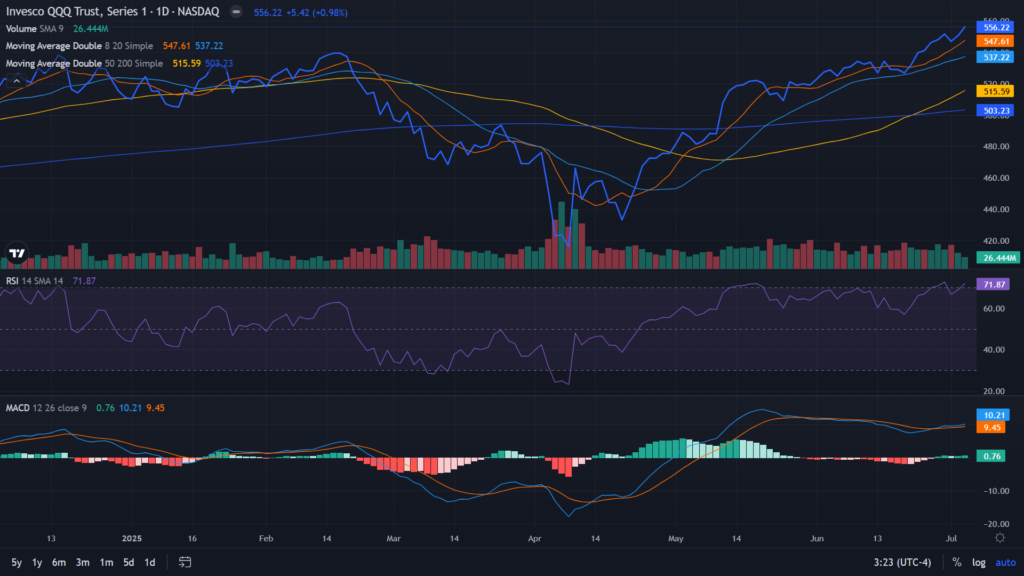
After the truncated trading week on Thursday, the SPY was up 0.79% at $625.34, while the QQQ advanced 0.98% to $556.22, according to Benzinga Pro data.
On Monday, the futures of the S&P 500, Dow Jones, and Nasdaq 100 indices were trading lower.
Read Next:
Photo courtesy: Shutterstock