

International Business Machines Corporation IBM
Regular-session close
After hours · Nov 19, 7:43 PM ET
- YTD
- -24.42%
- 1 year
- -22.41%
5D -21.82 (-8.88%)
- Market cap
- 211.59B
- Revenue (ttm)
- 69.87B
- Profit margin
- 15.99%
- EPS (ttm)
- 11.72
- Shares out
- 945.12M
- P/E ratio
- 19.10
- Forward P/E
- 16.91
- Dividend
- 6.76 (2.96%)
- Ex-dividend date
- Nov 10, 2026
- YTD return
- -24.42%
- 1-year return
- -22.41%
- Volume
- 3.77M
- Avg volume
- 5.15M
- Open
- 229.22
- Previous close
- 228.53
- Day's range
- 222.74 – 232.75
- 52-week range
- 199.19 – 332.46
- Beta
- 0.76
- Analysts
- Buy
- Price target
- 259.85 (+16.1%)
- Earnings date
- Jan 27, 2027
- 50-day average
- 237.93
Key statistics
- 200-day average
- 245.63
- Enterprise value
- 272.74B
- PEG ratio
- 2.15
- Price / sales
- 3.03
- Price / book
- 5.95
- Payout ratio
- 57.51%
- Revenue growth
- 4.70%
- Free cash flow
- 12.35B
- Total cash
- 11.06B
- Total debt
- 67.14B
- Return on equity
- 34.77%
- Short % of float
- 2.09%
Fundamental scorecard
20 of 25 checks passed on IBM’s reported financials
20of 25 checks passed
- Value 4 of 5
- Growth 4 of 5
- Profitability 5 of 5
- Financial health 2 of 5
- Dividend 5 of 5
Statements to Sep 30, 2026.
Analyst view
Consensus: buy
- Target (low)
- 174.00
- Target (mean)
- 259.85
- Target (high)
- 300.00
- Strong buy3
- Buy9
- Hold11
- Sell1
- Strong sell1
Next earnings
Jan 27, 2027
Expected Jan 27, 2027. Consensus EPS estimate 4.63.
Financials — quick view
Earnings
| Report date | Quarter ending | EPS estimate | EPS reported | Surprise | Surprise % |
|---|---|---|---|---|---|
| Jan 27, 2027 | Dec 30, 2026 | 4.63 | — | — | — |
| Oct 21, 2026 | Sep 30, 2026 | 2.86 | 2.95 | +0.09 | +3.15% |
| Jul 22, 2026 | Jun 30, 2026 | 2.95 | 2.93 | -0.02 | -0.68% |
| Apr 22, 2026 | Mar 31, 2026 | 1.81 | 1.91 | +0.10 | +5.52% |
| Jan 28, 2026 | Dec 31, 2025 | 4.31 | 4.52 | +0.21 | +4.87% |
| Oct 22, 2025 | Sep 30, 2025 | 2.45 | 2.65 | +0.20 | +8.16% |
Upgrades / downgrades
| Date | Firm | Action | From | To |
|---|---|---|---|---|
| Oct 22, 2026 | Jefferies | main | Buy | Buy |
| Oct 22, 2026 | UBS | main | Neutral | Neutral |
| Oct 22, 2026 | Citigroup | main | Buy | Buy |
| Oct 22, 2026 | Morgan Stanley | main | Equal-Weight | Equal-Weight |
| Oct 22, 2026 | BMO Capital | main | Market Perform | Market Perform |
| Oct 22, 2026 | Barclays | main | Overweight | Overweight |
About International Business Machines Corporation
International Business Machines Corporation, together with its subsidiaries, provides integrated solutions and services in the Americas, Europe, the Middle East, Africa, and the Asia Pacific. It operates through Software, Consulting, Infrastructure, and Financing segments. The Software segment offers hybrid cloud and AI platforms that allow clients to realize their digital and AI transformations across the applications, data, and environments in which they operate. The Consulting segment delivers strategy and technology services and intelligent operations, providing business transformation, technology implementation, managed services, application modernization, and AI-powered solutions. The Infrastructure segment provides on-premises and cloud-based server, and storage solutions, as well as life-cycle services for hybrid cloud infrastructure deployment. The Financing segment offers client and commercial financing, and facilitates IBM clients' acquisition of hardware, software, and services. It operates a data streaming platform. The company has partnerships with various companies, including hyperscalers, service providers, global system integrators, and software and hardware vendors that include Adobe, Amazon Web Services, Microsoft, Oracle, Salesforce, Samsung Electronics and SAP, and others. It also has a collaboration with Arm Holdings plc to develop new dual-architecture hardware for AI and data intensive workloads; partnership with three.ws to advance ai-powered 3d agent technology; and collaboration with Lightwell to help strengthen open source software supply chain. Additionally, it offers operational resilience, logistics, and future-ready technology to the UK Ministry of Defence through Team ORION. The company was formerly known as Computing-Tabulating-Recording Co. and changed its name to International Business Machines Corporation in 1924. International Business Machines Corporation was incorporated in 1911 and is headquartered in Armonk, New York.
- Sector
- Technology
- Industry
- Information Technology Services
- Country
- United States
- Website
- ibm.com
News
 IBM Stock Is Down About 23% in 2026. Here's Where I Think It Will Be in 2030.
 4 Tech Dividend Stocks Yielding Over 2% That Retirees Can Own for Growth and Income
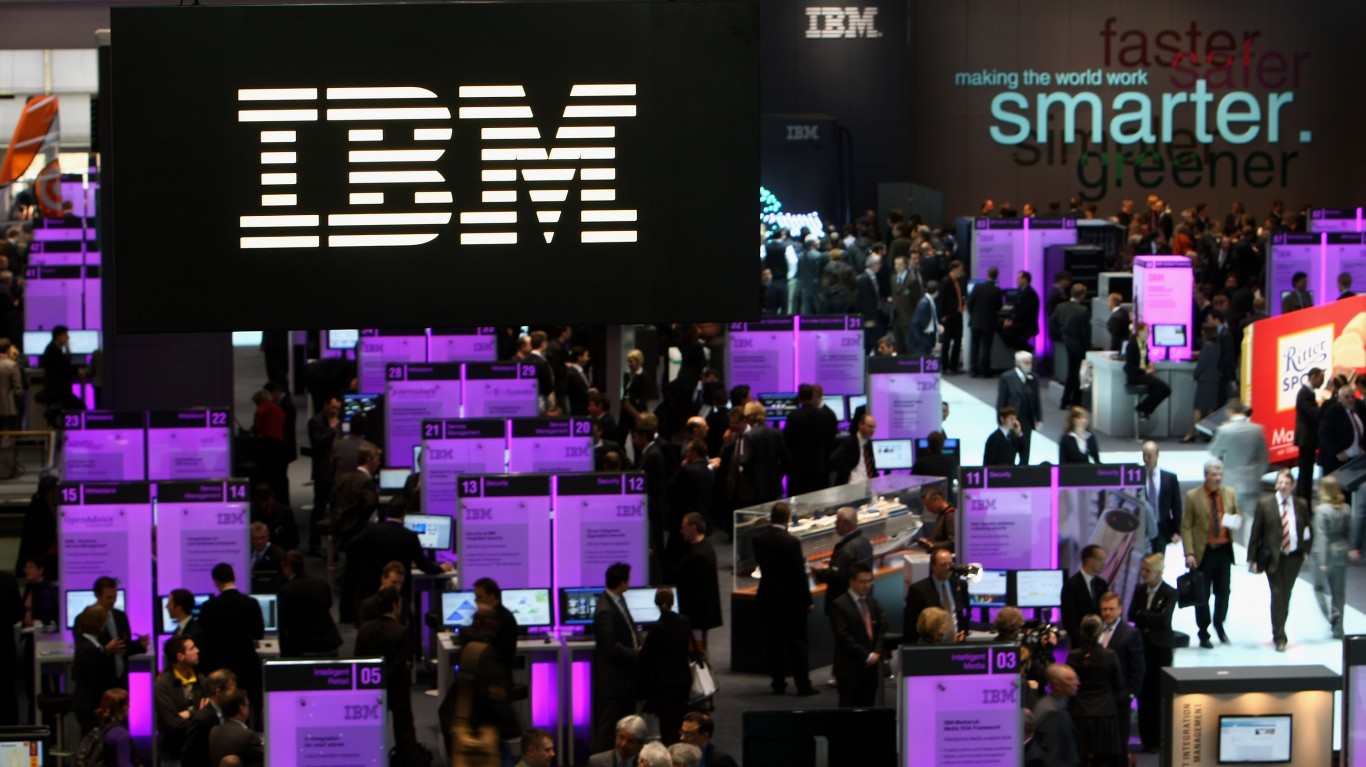 Forget Market Crashes: These Dow Jones Giants Have Recession-Proof Dividends
 IBM and Red Hat Bring Lightwell Network to Microsoft Marketplace
 Bogart Wealth LLC Buys 2,962 Shares of International Business Machines Corporation $IBM
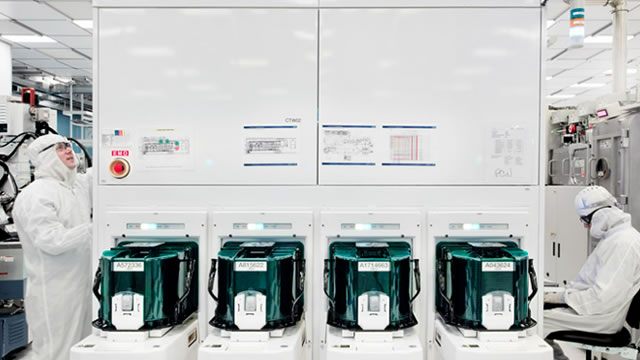 IBM Is Down 21% This Year. What Will It Take to Get IBM Stock Back to $250?
 IBM Stock Is Hiding A Secret We'll Learn In 2027 (And A Ticking Clock)
 Is Trending Stock International Business Machines Corporation (IBM) a Buy Now?
 5 Huge Dividend Payers the IRS Leaves Alone Inside a Roth
 IBM Study: Chief AI Officers See Where AI Creates Value, but Few Control Investment Decisions
Your note
Sign in to keep a note on IBM — it syncs with the Stock Master app.
Insider holders
| Insider | Relation | Latest transaction | Date | Shares held |
|---|---|---|---|---|
| COHN GARY D | Officer | Conversion of Exercise of derivative security | Feb 19, 2026 | 110,590 |
| FARR DAVID N | Director | Purchase | Jan 29, 2026 | 9,258 |
| FEHRING NICOLAS A. | Officer | Stock Gift | Jun 3, 2026 | 16,577 |
| HOWARD MICHELLE J. | Director | Purchase | Feb 24, 2026 | 194 |
| KAVANAUGH JAMES J. | Chief Financial Officer | Conversion of Exercise of derivative security | Feb 19, 2026 | 175,392 |
| KRISHNA ARVIND | Chief Executive Officer | Conversion of Exercise of derivative security | Feb 19, 2026 | 371,894 |
Institution ownership
| Holder | % held | Shares | Value | Reported |
|---|---|---|---|---|
| Blackrock Inc. | 8.04% | 75,972,691 | 17.01B | Sep 29, 2026 |
| Vanguard Capital Management LLC | 6.52% | 61,668,152 | 13.81B | Sep 29, 2026 |
| State Street Corporation | 5.91% | 55,859,074 | 12.51B | Sep 29, 2026 |
| Vanguard Portfolio Management LLC | 3.01% | 28,494,218 | 6.38B | Sep 29, 2026 |
| Geode Capital Management, LLC | 2.53% | 23,948,239 | 5.36B | Sep 29, 2026 |
| Morgan Stanley | 1.79% | 16,929,285 | 3.79B | Sep 29, 2026 |
Fund ownership
| Holder | % held | Shares | Value | Reported |
|---|---|---|---|---|
| VANGUARD INDEX FUNDS-Vanguard Total Stock Market Index Fund | 3.16% | 29,838,330 | 6.68B | Jun 29, 2026 |
| VANGUARD INDEX FUNDS-Vanguard 500 Index Fund | 2.58% | 24,358,666 | 5.45B | Jun 29, 2026 |
| iShares Trust-iShares Core S&P 500 ETF | 1.33% | 12,553,607 | 2.81B | Sep 29, 2026 |
| Fidelity Concord Street Trust-Fidelity 500 Index Fund | 1.30% | 12,243,940 | 2.74B | Sep 29, 2026 |
| SPDR S&P 500 ETF TRUST-State Street SPDR S&P 500 ETF Trust | 1.23% | 11,656,679 | 2.61B | Sep 29, 2026 |
| VANGUARD INDEX FUNDS-Vanguard Value Index Fund | 0.95% | 8,946,641 | 2.00B | Jun 29, 2026 |